Use Case: Label Repair Console
Create one polished public-gallery concept image titled exactly "Use Case: Label Repair Console". Output format: one 16:9 high-re...
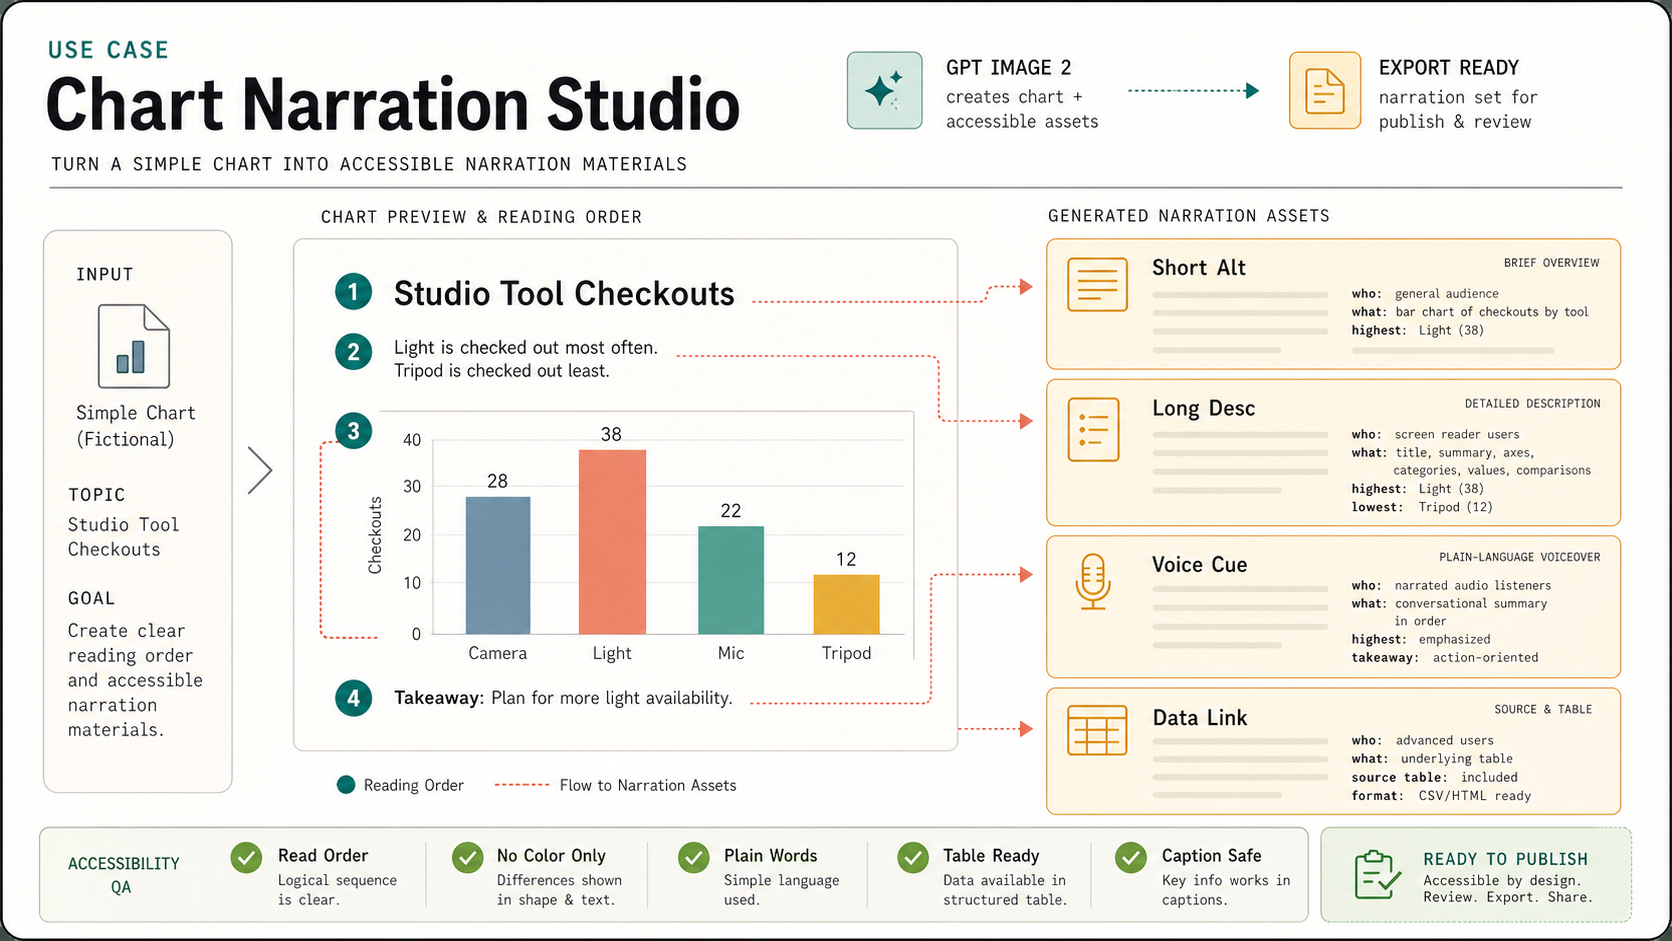
把 GPT Image 2 用在图表无障碍伴随材料:同一张虚构工具借用图表生成阅读顺序、Short Alt、Long Desc、Voice Cue、Data Link 和 plain-language QA。
Use this as a reference for Alt Text, Chart Accessibility, Chart Narration Studio, Data Literacy workflows, prompt structure, visual constraints, and output review.
Create one polished public-gallery concept image titled exactly "Use Case: Chart Narration Studio".

Use case: accessibility material / data-literacy / content-production workflow.
Asset type: landscape 16:9 editorial production board for a GPT Image 2 use-case gallery.

Primary request: Show GPT Image 2 being used to turn a simple fictional chart into accessible narration materials: reading order, short alt text, long description, and plain-language voiceover cue cards. This must be a chart-accessibility production workflow, not chart fact-checking, not a data poster proof, not a dashboard, not a map, not a menu, not signage, not a classroom worksheet, and not a tabletop object.

Fictional low-stakes chart: "Studio Tool Checkouts" with four simple categories: "Camera", "Light", "Mic", "Tripod". Keep numbers small and secondary; no real organization or real data.

Composition: center-left shows one clean simple chart preview with numbered reading-order dots: 1 title, 2 summary, 3 categories, 4 takeaway. Right side shows four stacked narration cards with short readable headings: "Short Alt", "Long Desc", "Voice Cue", "Data Link". The cards contain only tiny abstract line blocks plus a few readable phrases: "who", "what", "highest", "source table". Bottom strip shows accessibility QA chips: "Read Order", "No Color Only", "Plain Words", "Table Ready", "Caption Safe". Add subtle flow arrows from chart parts to narration cards.

Visual style: refined accessibility design studio artifact, crisp vector layout on warm white paper, soft graphite text, teal reading-order dots, amber cue cards, coral emphasis marks, deep green ready chips. Professional data-journalism and UX-writing feel, not decorative infographic hype. Clear short typography, generous margins, exact alignment, inspectable public-gallery quality.

Show the use-case mechanism clearly: image generation creates not just the chart but also companion accessible description assets and a reviewable reading sequence.

Safety and originality constraints: no real datasets, no real brands, no logos, no public figures, no politics/elections/parties, no medical/legal claims, no harmful instructions, no adult or explicit content, no gore, no celebrity likeness, no copyrighted characters, no living-artist style imitation. Do not copy any external prompt, chart, layout, image, dataset, product UI, or source style.
Source note: Original fictional chart narration workflow generated locally after external source sweep. Sources informed abstract infographic prompt structure, poster/text failure modes, chart prompt failure modes, chart accessibility requirements, and infographic-chart benchmark patterns only; no external prompt text, image, chart, dataset, product UI, brand, character, artwork, protected style, or source image was reused.
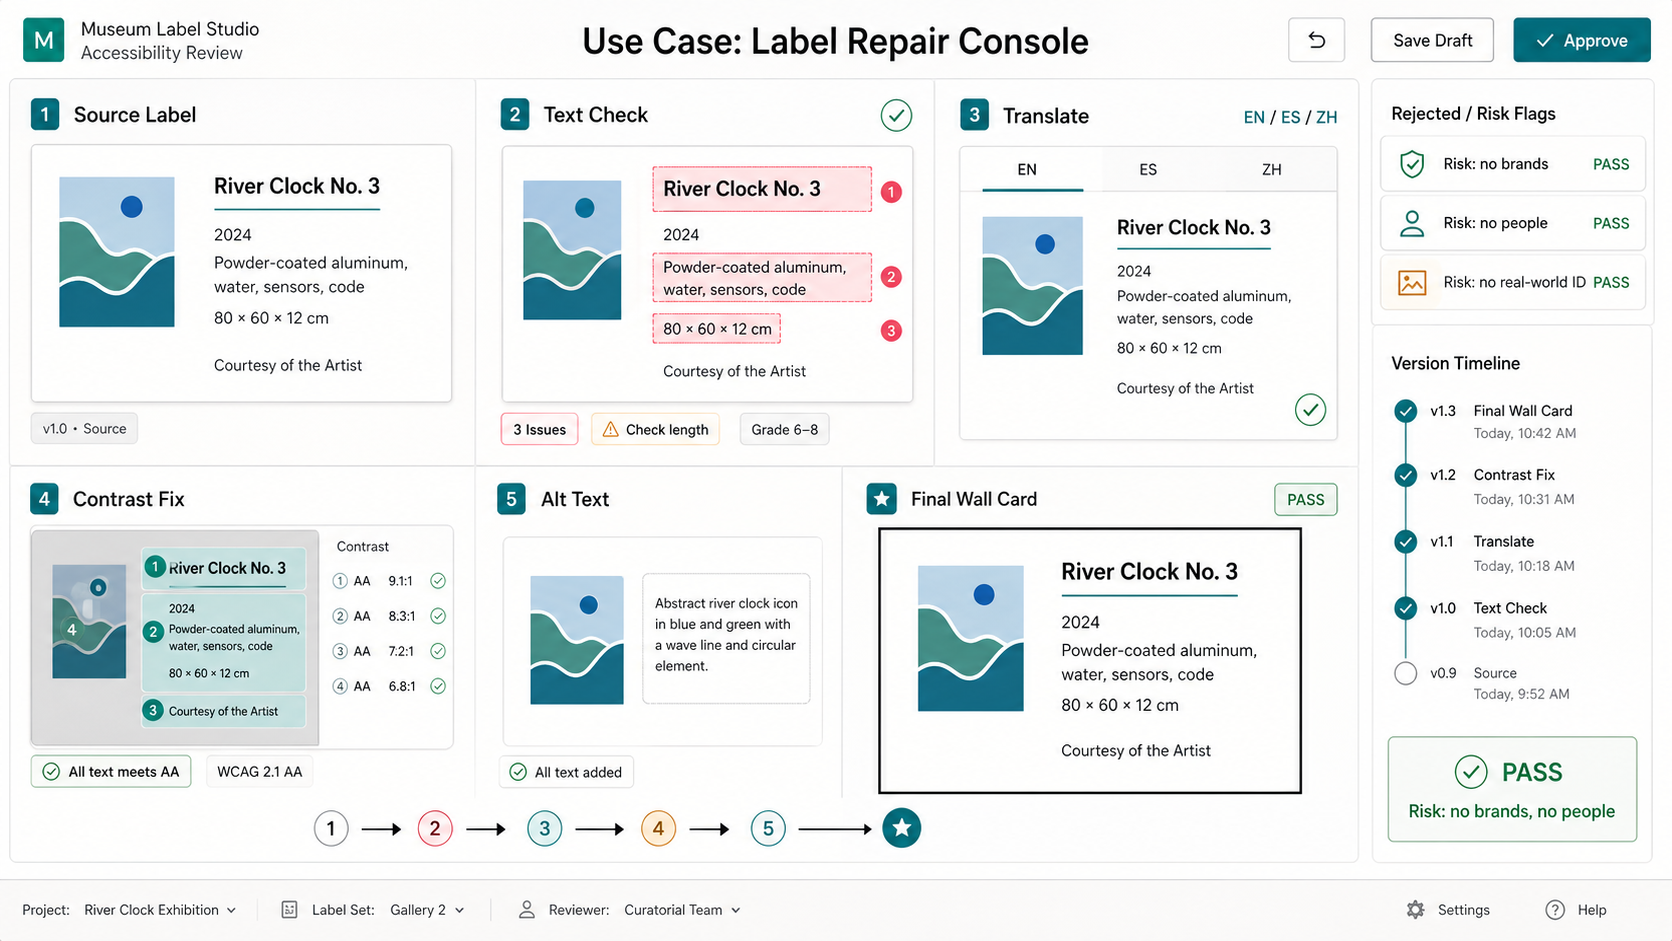
Create one polished public-gallery concept image titled exactly "Use Case: Label Repair Console". Output format: one 16:9 high-re...
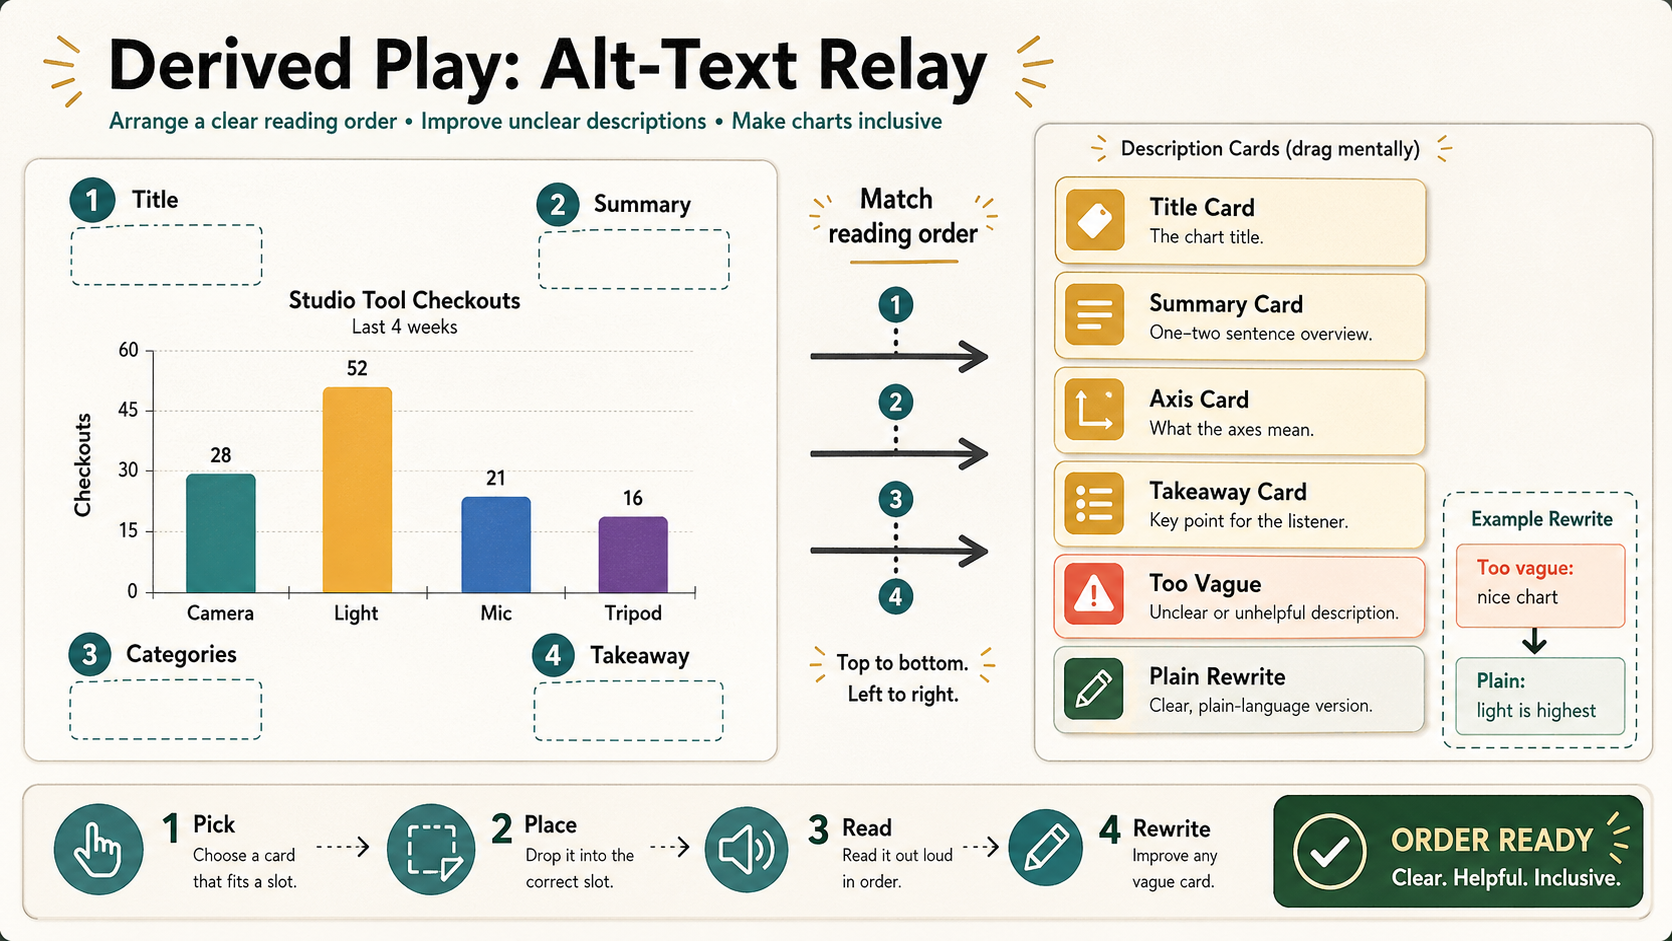
Create one polished public-gallery concept image titled exactly "Derived Play: Alt-Text Relay". Use case: derived play mechanic /...
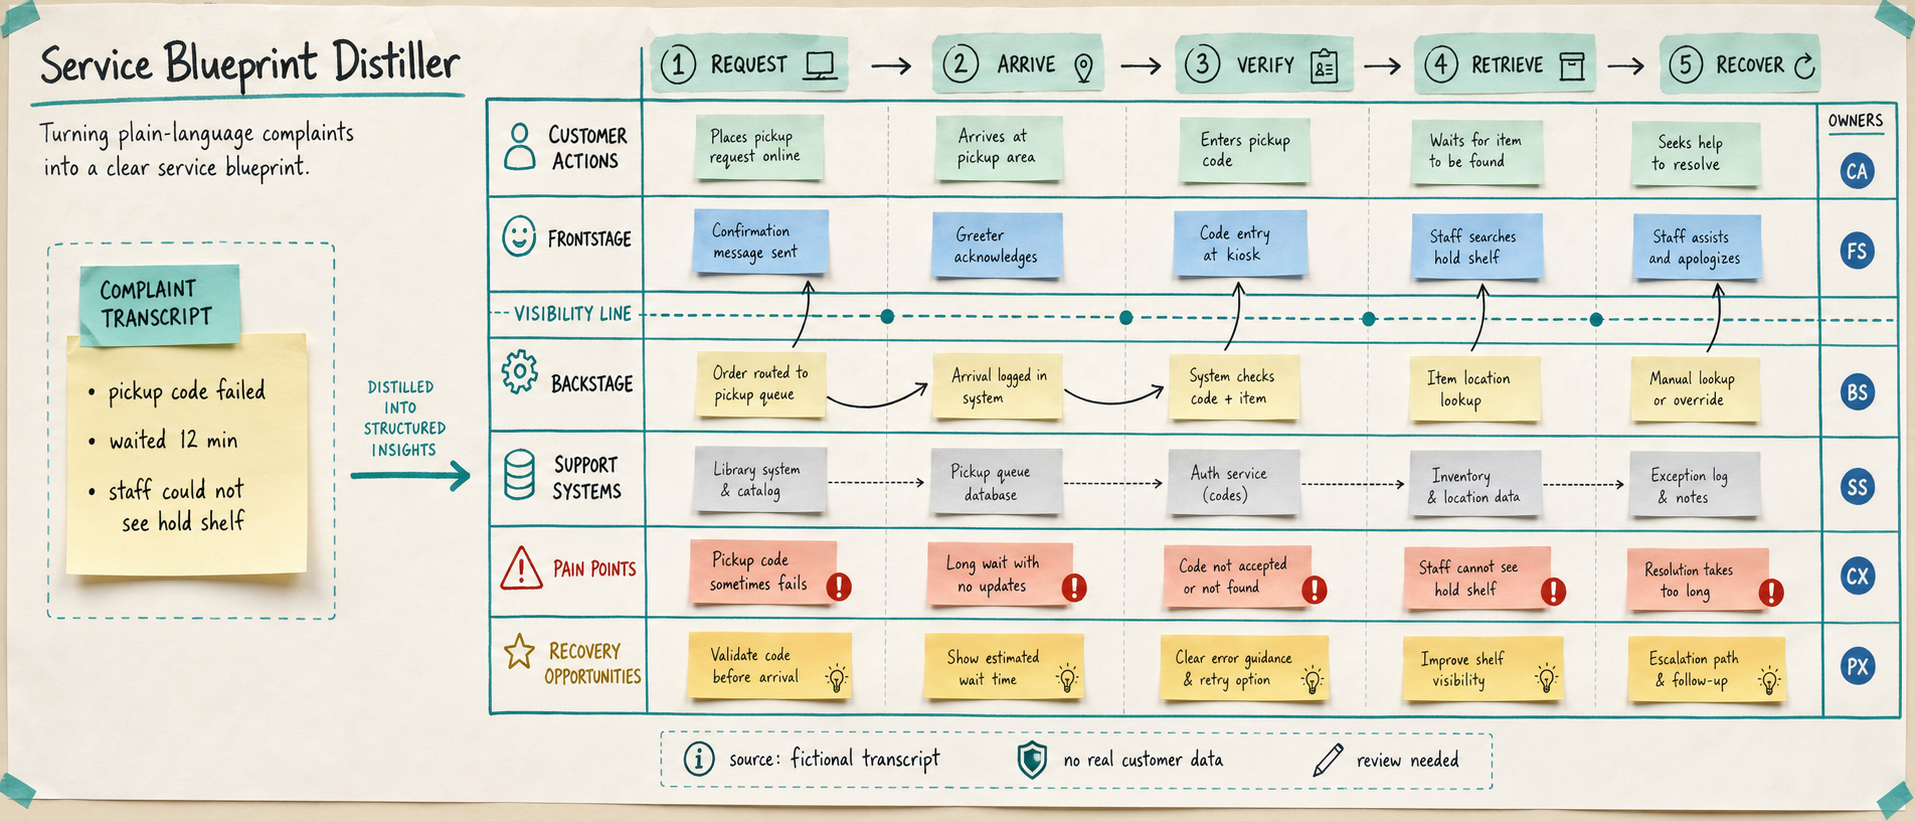
Use case: productivity-visual / service-design workflow Asset type: public gallery image for GPT Image 2 use-case research, ultra...
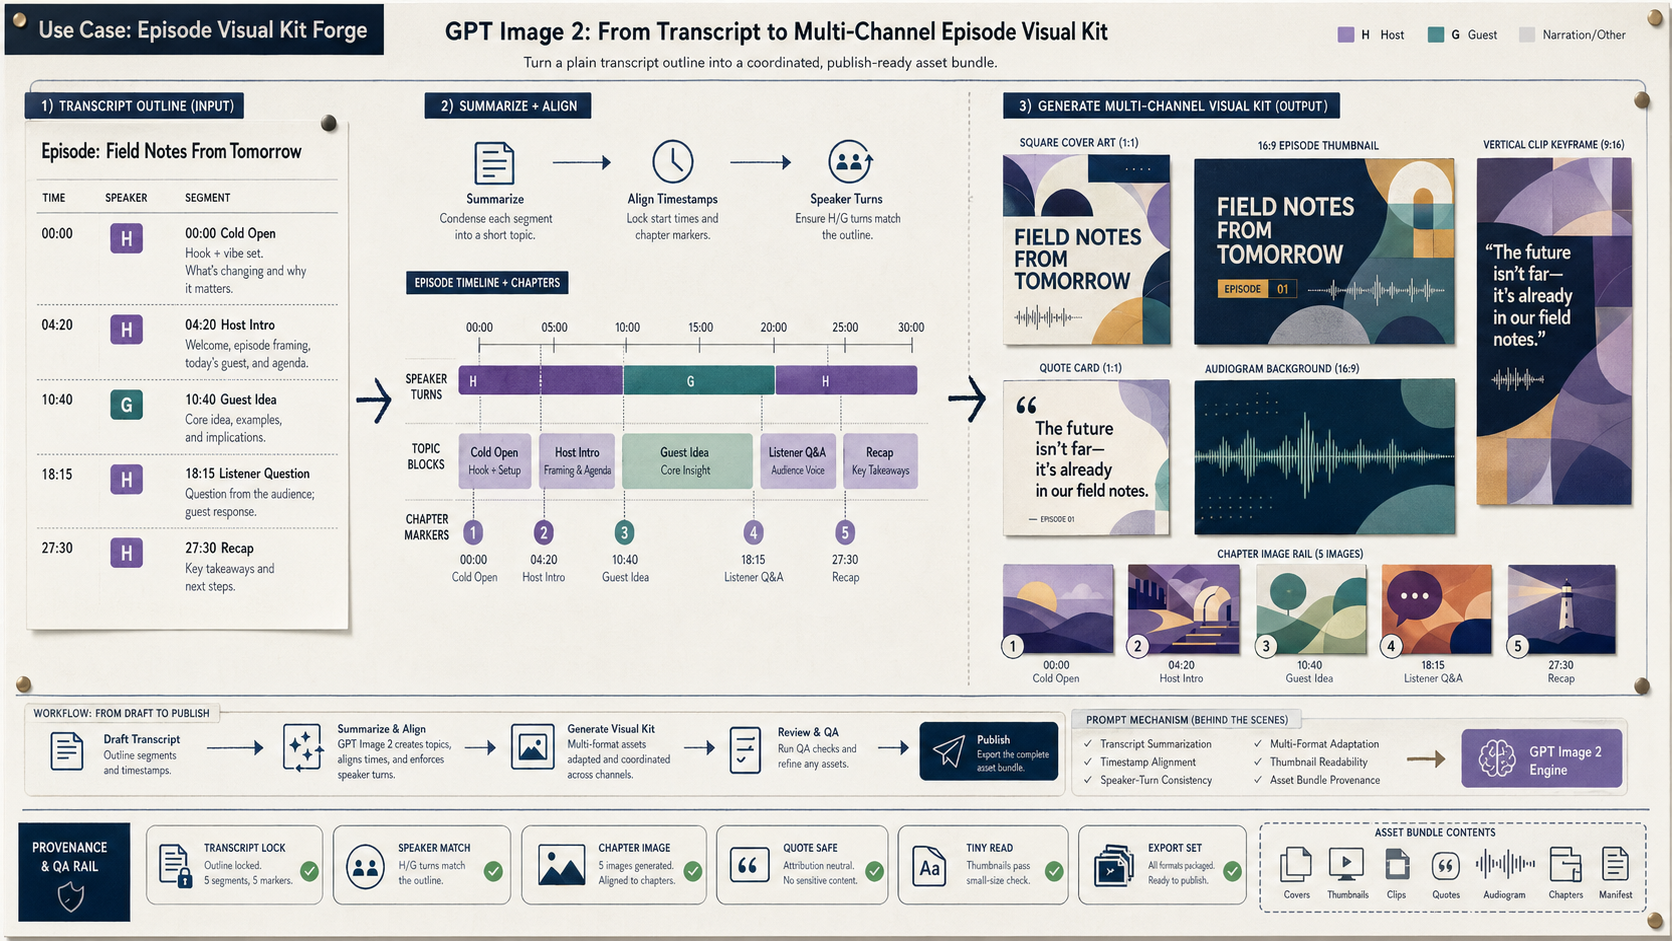
Create a wide 16:9 fictional podcast production artifact titled in small clear text "Use Case: Episode Visual Kit Forge". Show ho...
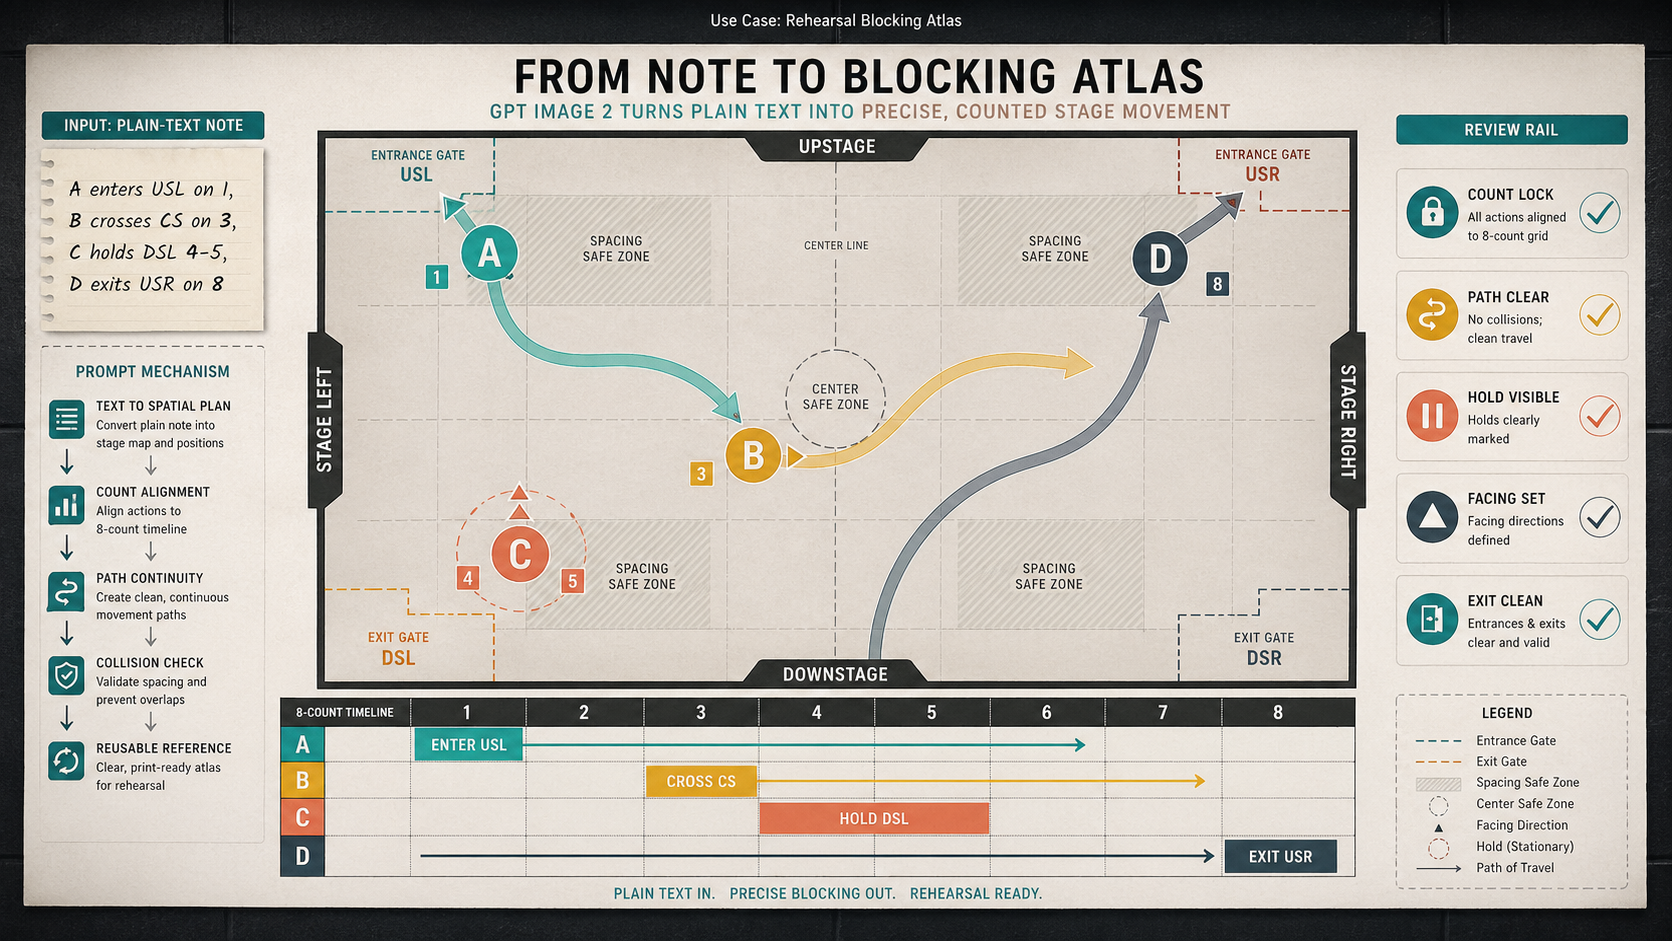
Create a wide 16:9 fictional rehearsal planning artifact titled visually only in small text as "Use Case: Rehearsal Blocking Atla...
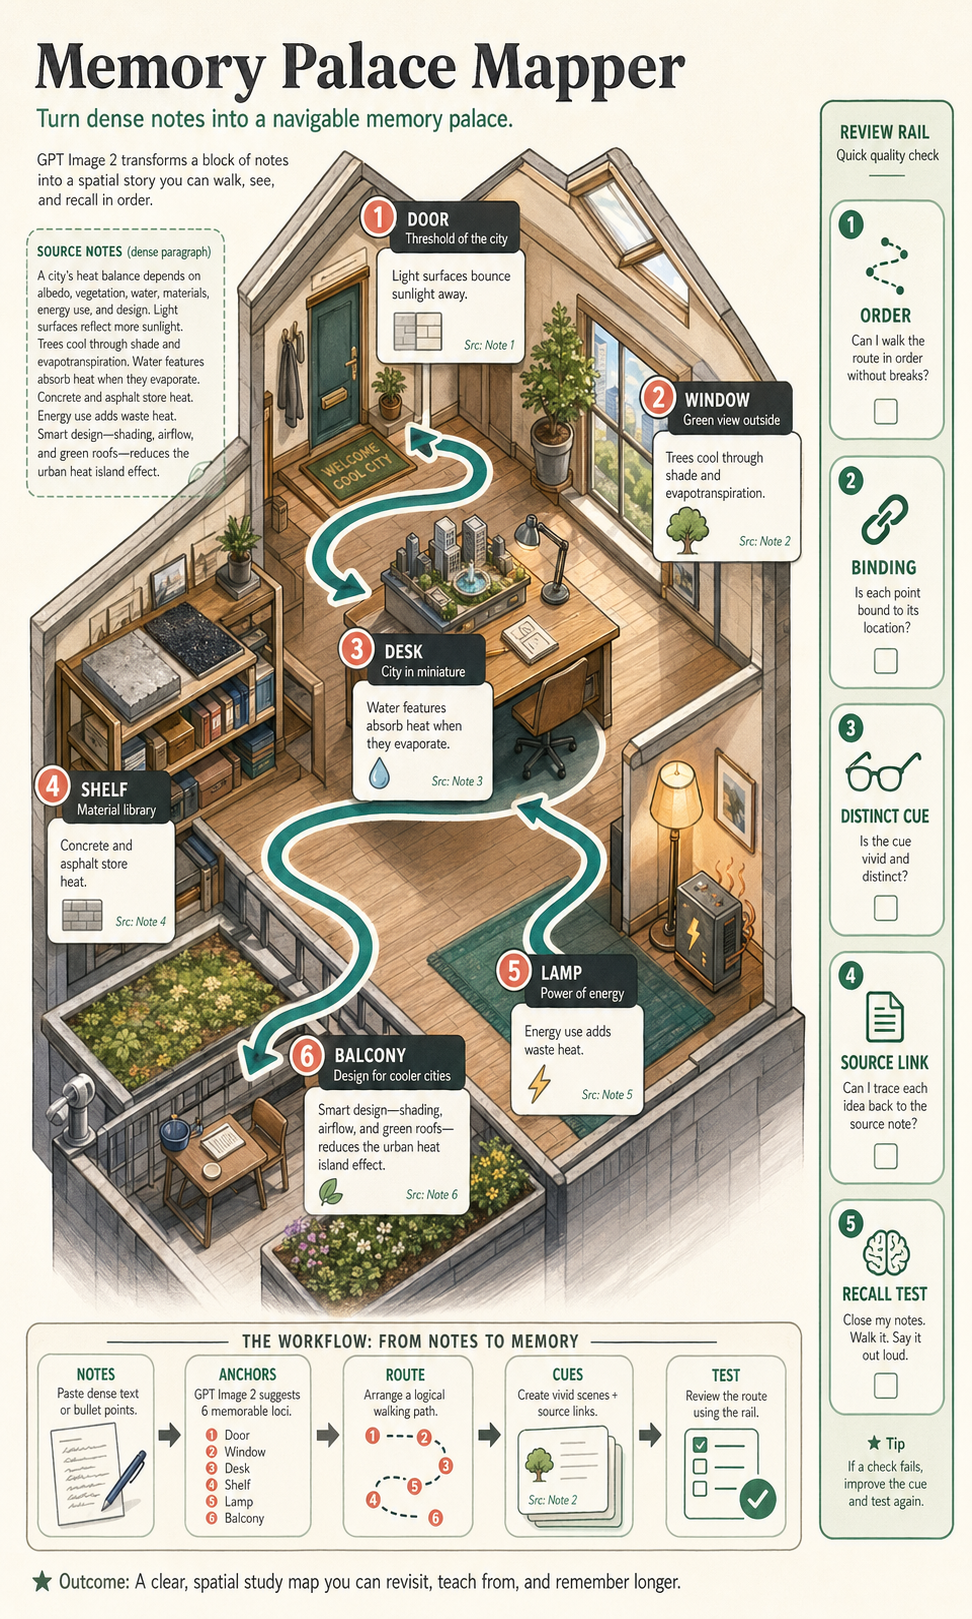
Create a polished, public-gallery image for GPT Image 2 use-case research. Use case: scientific-educational / productivity-visual...